Is the IO high?
Sometimes I want to confirm that if I really have a write bottleneck. The tool refered commonly is iostat, such as iostat -x
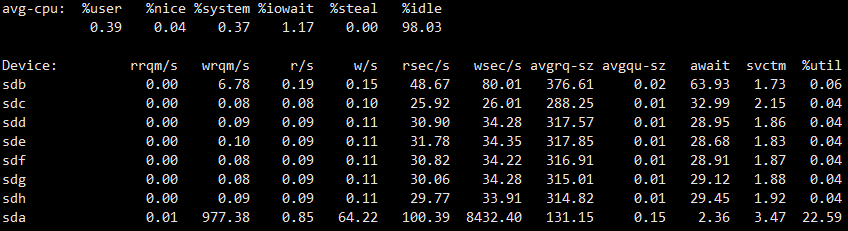
But the %util
Percentage of CPU time during which I/O requests were issued to the device (bandwidth utilization for the device). Device saturation occurs when this value is close to 100%.
is not precise, because it’s measured by CPU time and affected by parallelism, as explained in Two traps in iostat: %util and svctm.
An alternative is using dstat, such as dstat -tdf --disk-util --nocolor
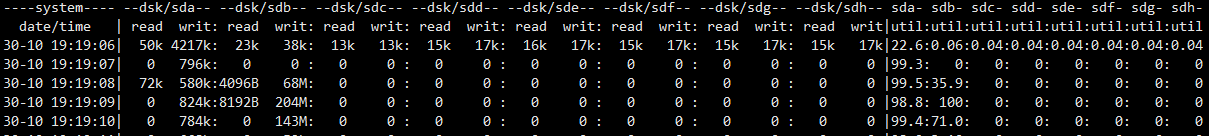
we can get a clear view and it’s easier to understand the unit of read/write in the output of dstat.
Disk bandwidth
As described before, we can get the spped of read/write by iostat or dstat, but it may not be enough to determine if we get a bottleneck. We can check it by comparing with its upper limit.
## write 2G of zeros to a file
$ dd if=/dev/zero of=test bs=1048576 count=2048
2048+0 records in
2048+0 records out
2147483648 bytes (2.1 GB) copied, 1.81074 s, 1.2 GB/s
...

## read a 2G file
$ dd if=test of=/dev/null bs=1048576
2048+0 records in
2048+0 records out
2147483648 bytes (2.1 GB) copied, 0.539638 s, 4.0 GB/s
The upper limit from dd may be too high, hdparm may give a more pratical answer
# hdparm -tT /dev/sda

/dev/sda:
 Timing cached reads:   15794 MB in  2.00 seconds = 7907.76 MB/sec
 Timing buffered disk reads:  580 MB in  3.00 seconds = 193.17 MB/sec
Refer:
Which process cause high IO?
The tool iotop is the first choice, but it may be not installed. An method to find high IO by ps can be found here: Troubleshooting High I/O Wait in Linux